

I know what you were thinking when you woke up this morning: “How many tokens per second can you get with a 2.5 year old CPU running inference on a 3 year old 1.1B model?” So I wrote this post for you.
Here are some benchmarks of the Intel Core Ultra 7 265KF alongside 5600Mhz DDR5, running TinyLlama 1.1B, at different degrees of quantisation.
If you want to skip the preamble, you can jump straight to the key findings here.
The model: TinyLlama 1.1B
This is a test of TinyLlama 1.1B – specifically the quantisations created by TheBloke:
- Q2_K
- Q3_K_S
- Q3_K_M
- Q3_K_L
- Q4_0
- Q4_K_S
- Q4_K_M
- Q5_0
- Q5_K_S
- Q5_K_M
- Q6_K
- Q8_0
And I got the F16 version from andrijdavid.
TinyLlama may be small but don’t count it out – it’s got a plucky attitude, and when aggresively fine-tuned, small models can out-perform larger ones in specific tasks
The CPU: Intel Core Ultra 7 265KF
You can see the Ultra 7 265KF’s full specs here, but the main highlight is the cores:
- 8 performance cores (P-Cores)
- 12 efficiency cores (E-Cores)
See this video from Intel for what they are, but basically:
- the P-Cores are much faster and do the heavy lifting
- the E-Cores are much smaller (~4 times smaller!) and less powerful, but can handle the OS, background tasks, spotify etc. while you use the P-Cores in your active app
So you might think, what’s the point of having 12 slower cores? Why not just bolt on 2 or 4 more fast cores? Well, there are a few advantages:
- Power: E-Cores, as their name implies, draw less power. If you’re just browsing the internet, writing a blog post, streaming movies, they can handle that with less battery use/electricity cost.
- Highly parallel workloads: LLM inference doesn’t fit into this category, but if you have a task that can be parallelised – and is within the limits of the E-Cores – the speed increase of extra cores will be huge. Video editing and some data processing falls into this bucket, as does having many different processes running at the same time.
Or that’s the claim, at least. A lot of these benefits rely on the cores being allocated to tasks correctly – which may not always be the case.
How many cores should you use for LLM inference?
I’ve often read two common pieces of advice:
- more than 4 cores is a waste
- E-Cores don’t give any benefit
I suspect that (1) may depend on the specific CPU and RAM speed. For (2), I expect this to be true – in fact, I think adding the E-Cores could potentially be detrimental.
Part of the issue here is memory bandwidth. During inference, the model weights must be repeatedly read from memory for every token generated. That means if you want a speed of, say 50 t/s, the model weights need to be streamed to the CPU 50 times every single second. Because LLMs are so big, we’ll soon hit physical limits – data can only be read from RAM so fast.

Made with Z-Image Turbo.
Imagine you run a restaurant. If you have 4 chefs who can chop 1 carrot per second, and your kitchen is given 4 carrots a second, your kitchen will chop all 4 of those carrots every second. Very efficient.
But let’s say you want to chop more carrots. How would you do that?
If you add more chefs without supplying more carrots, you will still only chop 4 carrots a second. Four of your chefs will be able to chop all the carrots, and the rest will be stood doing nothing.
If you supply more carrots without adding more chefs, again, you’ll still be chopping 4 carrots a second. You’ll just build an ever growing stockpile of carrots waiting to be chopped.
So you’d need to increase the supply of carrots (memory speed), and balance it with the number of chefs (number of cores/processer speed).
Both of these have physical upper limits. In the case of CPU inference, the supply is typically the problem – your chefs are highly skilled and ready to chop, but your carrot supplier can only bring them in so fast. Which is to say, memory bandwidth limits the speed that data can be streamed to the CPU, and this is the bottleneck – not the CPU’s processing speed.
Once you know exactly where that bottleneck is, you can allocate the right number of chefs/cores. The question is – but where is it? Is it at 4 cores? Eight Cores? Sixteen Cores?
Are E-Cores useful?
When it comes to the E-Cores, adding more might make things worse.
E-Cores are like slower chefs, who can only chop 1 carrot every 2 seconds. Why would that be a problem though? Every little helps right?
Well the problem is that although the calculations during inference can be parallelised, each token must be produced sequentially. You cannot start generating the second token until you know what the first token is.
So it’s possible that in some cases, the E-Cores might slow the operation down, because the fast cores have finished their allocated work, and are stood idle waiting for the E-Cores to finish.
Hypotheses
These will be the main hypotheses we shall test:
- We should see higher t/s with lower bit quantisation
- We should see clear scaling up in t/s as we add more P-Cores.
- At some point (maybe at 4 P-Cores), the t/s will tail off
- Adding E-Cores will not increase t/s, and may even decrease it
Method
Hardware
As noted:
- Processor: Intel Core Ultra 7 265KF
- RAM 5600 Mhz 32GB
Software
- I used Jeneration Lab to run the experiments
- The inference backend was llama_cpp_python 0.3.16
Conditions
- Exact same prompt
- Prompt: “Write a 500 word story involving a Samurai, a cowboy, a Victorian gentleman, a coca cola, Nintendo playing cards, and Dracula.” (57 tokens)
- Same output length – capped at 512 tokens
- Ran for each quantisation in TheBloke’s repo (12 models), plus andrijdavid’s F16 GGUF, with 1 to 20 threads, repeated 4 times to average out fluctuations. So 1,040 generations total.
- Paused for 5 seconds each run to allow the CPU some cooldown time.
- Running on Ubuntu 24.04, the only applications running being Jeneration Lab in a terminal, PSensor, and the System Monitor
- 2 warmup runs before each timed run
Results
Best observed runs per model/number of threads
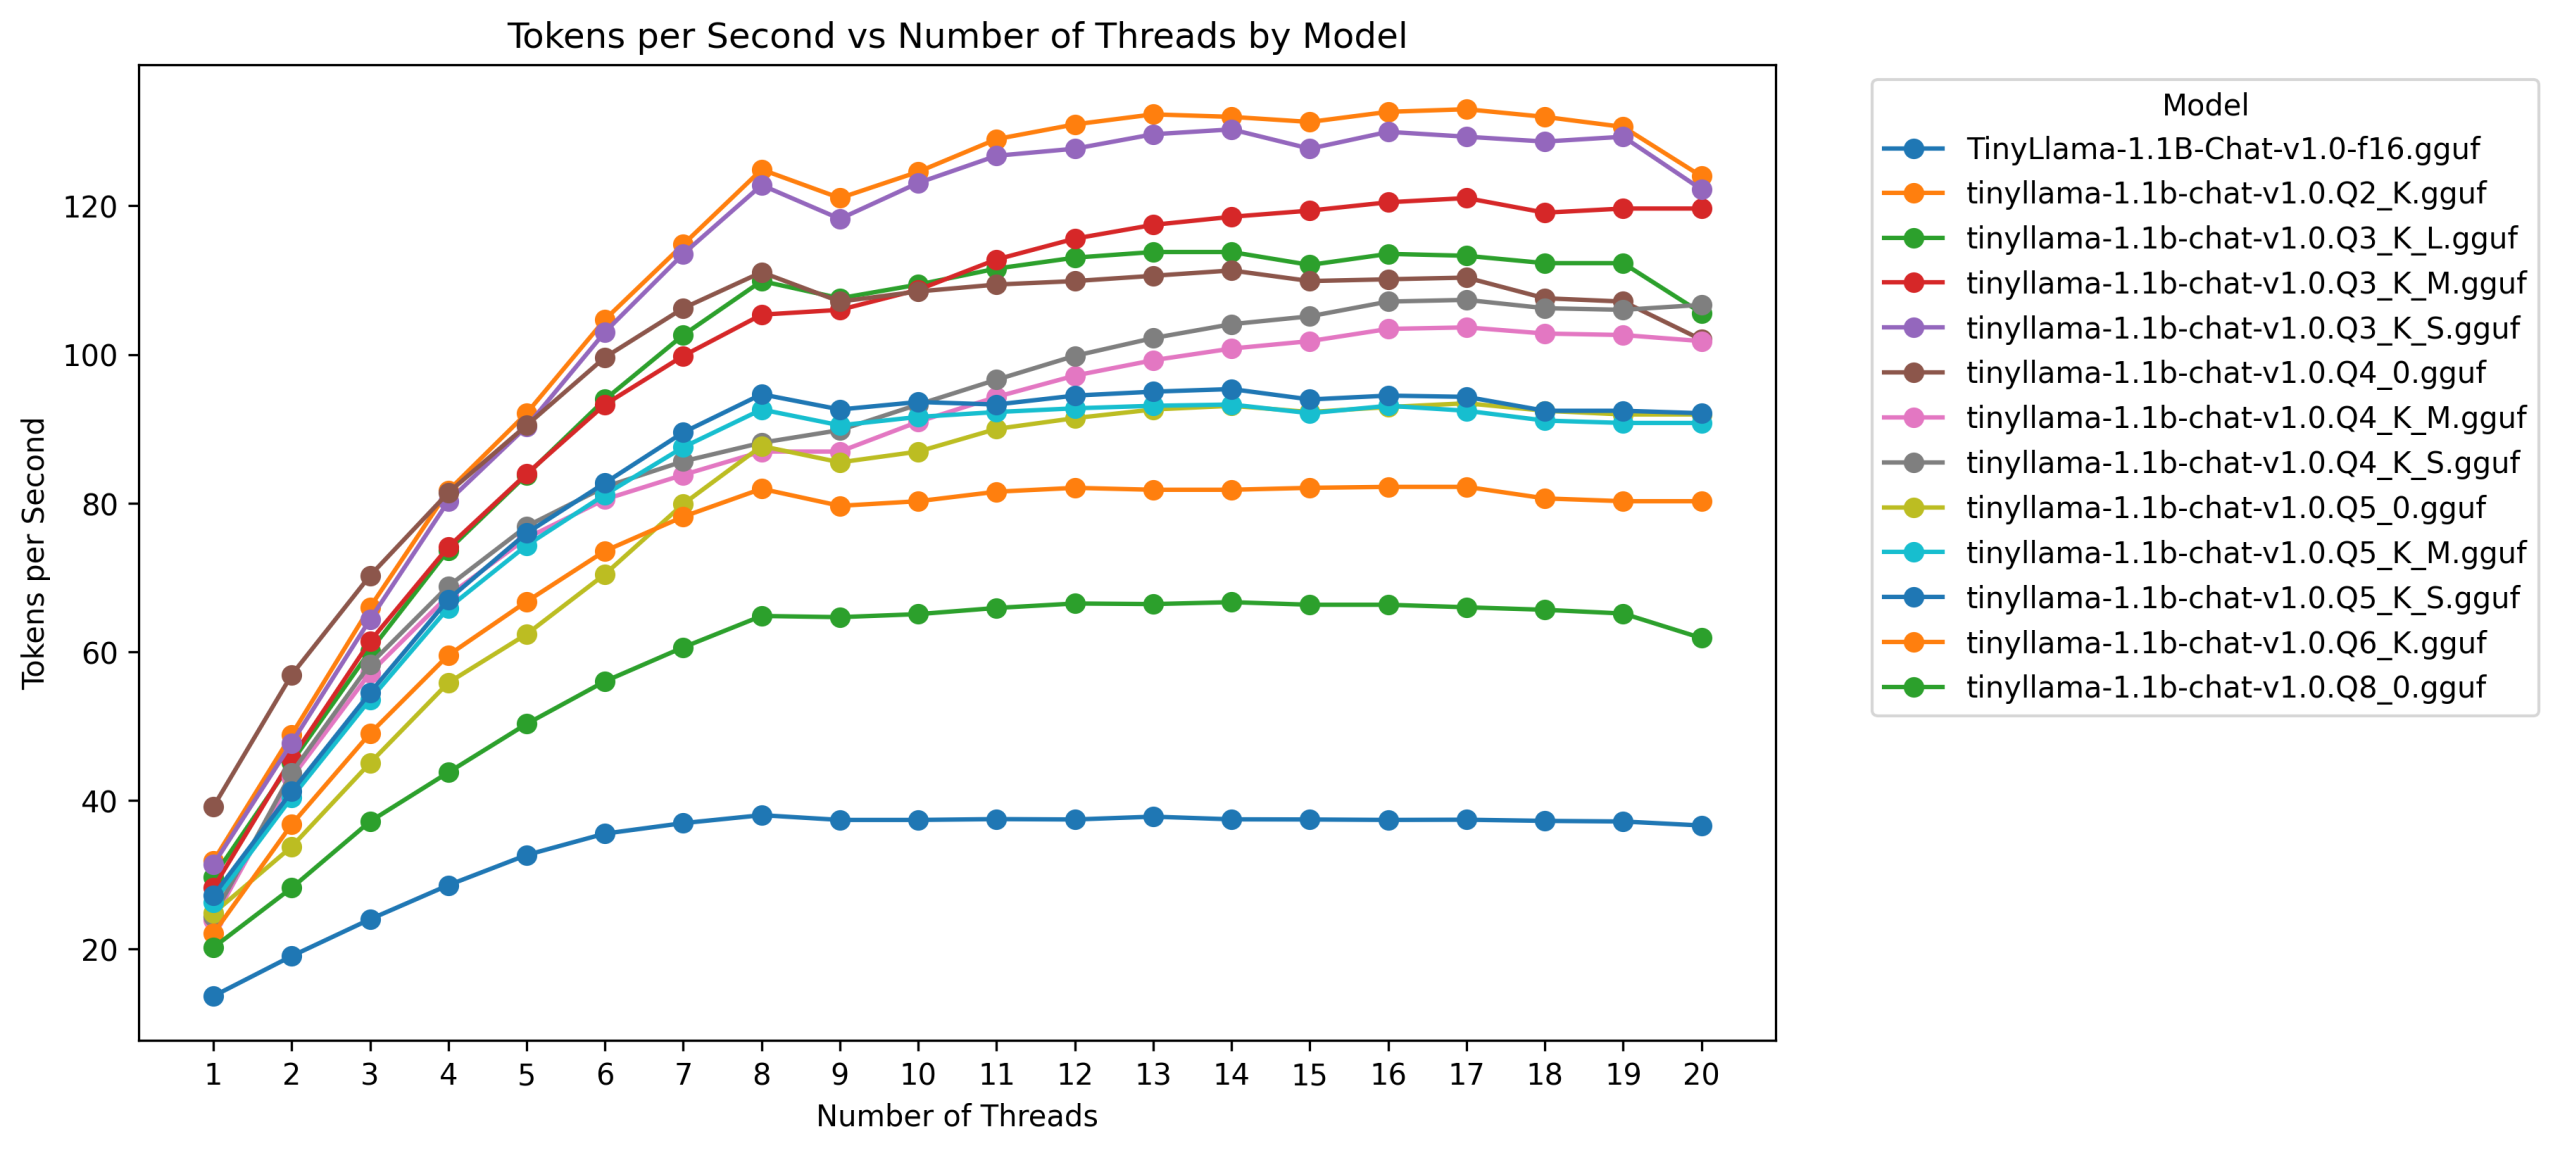
Here are the best t/s achieved by each quantisation and number of thread combo. The headers along the top show the number of threads requested in llama-cpp for that run:
| quant | 1 | 2 | 3 | 4 | 5 | 6 | 7 | 8 | 9 | 10 | 11 | 12 | 13 | 14 | 15 | 16 | 17 | 18 | 19 | 20 |
|---|---|---|---|---|---|---|---|---|---|---|---|---|---|---|---|---|---|---|---|---|
| Q2_K | 31.84 | 48.85 | 65.98 | 81.66 | 92.09 | 104.70 | 114.80 | 124.88 | 121.04 | 124.57 | 128.97 | 130.95 | 132.30 | 131.96 | 131.28 | 132.64 | 132.99 | 131.96 | 130.61 | 123.97 |
| Q3_K_S | 31.37 | 47.72 | 64.32 | 80.25 | 90.30 | 103.02 | 113.53 | 122.78 | 118.24 | 123.08 | 126.73 | 127.68 | 129.62 | 130.28 | 127.68 | 129.95 | 129.29 | 128.64 | 129.29 | 122.20 |
| Q3_K_M | 28.22 | 45.63 | 61.39 | 74.10 | 83.93 | 93.26 | 99.81 | 105.35 | 106.00 | 108.70 | 112.78 | 115.58 | 117.43 | 118.52 | 119.35 | 120.47 | 121.04 | 119.07 | 119.63 | 119.63 |
| Q3_K_L | 29.68 | 45.15 | 60.09 | 73.67 | 83.80 | 93.94 | 102.61 | 109.87 | 107.56 | 109.40 | 111.55 | 113.02 | 113.78 | 113.78 | 112.04 | 113.53 | 113.27 | 112.28 | 112.28 | 105.57 |
| Q4_0 | 39.14 | 56.89 | 70.23 | 81.40 | 90.46 | 99.61 | 106.22 | 111.06 | 107.11 | 108.47 | 109.40 | 109.87 | 110.58 | 111.30 | 109.87 | 110.11 | 110.34 | 107.56 | 107.11 | 101.99 |
| Q4_K_S | 24.39 | 43.72 | 58.31 | 68.82 | 76.88 | 82.18 | 85.62 | 88.12 | 89.82 | 93.26 | 96.60 | 99.81 | 102.20 | 104.07 | 105.13 | 107.11 | 107.34 | 106.22 | 106.00 | 106.67 |
| Q4_K_M | 23.91 | 43.06 | 57.14 | 67.55 | 75.29 | 80.50 | 83.80 | 86.93 | 86.93 | 90.94 | 94.29 | 97.15 | 99.22 | 100.79 | 101.79 | 103.43 | 103.64 | 102.81 | 102.61 | 101.79 |
| Q5_0 | 24.81 | 33.77 | 45.03 | 55.83 | 62.36 | 70.43 | 79.88 | 87.67 | 85.48 | 86.93 | 89.98 | 91.43 | 92.59 | 93.09 | 92.25 | 92.92 | 93.43 | 92.42 | 91.92 | 91.92 |
| Q5_K_S | 27.18 | 41.19 | 54.47 | 67.02 | 75.96 | 82.71 | 89.51 | 94.64 | 92.59 | 93.60 | 93.26 | 94.46 | 94.99 | 95.34 | 93.94 | 94.46 | 94.29 | 92.42 | 92.42 | 92.09 |
| Q5_K_M | 26.24 | 40.38 | 53.56 | 65.89 | 74.31 | 81.14 | 87.52 | 92.59 | 90.46 | 91.59 | 92.25 | 92.75 | 93.09 | 93.26 | 92.09 | 93.09 | 92.42 | 91.10 | 90.78 | 90.78 |
| Q6_K | 22.08 | 36.76 | 49.00 | 59.53 | 66.75 | 73.56 | 78.17 | 81.92 | 79.63 | 80.25 | 81.53 | 82.05 | 81.79 | 81.79 | 82.05 | 82.18 | 82.18 | 80.63 | 80.25 | 80.25 |
| Q8_0 | 20.20 | 28.22 | 37.16 | 43.76 | 50.29 | 56.02 | 60.59 | 64.81 | 64.65 | 65.06 | 65.89 | 66.49 | 66.41 | 66.67 | 66.32 | 66.32 | 65.98 | 65.64 | 65.14 | 61.84 |
| f16 | 13.66 | 19.05 | 24.00 | 28.59 | 32.65 | 35.53 | 36.94 | 38.01 | 37.37 | 37.37 | 37.48 | 37.43 | 37.81 | 37.45 | 37.43 | 37.37 | 37.40 | 37.24 | 37.16 | 36.62 |
Here’s the same data in a line chart:
All results
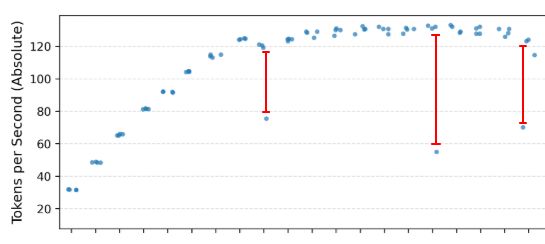
Here’s a very wide chart showing all the results:
![]()
The chart shows all the tokens per second observed for every quantisation at each number of threads. So 4 data points per quant/thread combo. We see that same tailing off pattern throughout, and we see higher speeds at lower bit quants.
But you’ll also see, as you scroll to the right, that the data points for each quant/thread combo are clustered tightly together. There’s very little variation. Except, for occasional very slow runs, sitting a long way below the main pack.
These appear to be slightly more common when 9 and 20 cores were in use.
Conditions
CPU temps never got higher than 76 degrees.
Based on occasional checks glancing at P Sensor, the 5-second pauses between generations brought all core temperatures to below 40 degrees.
Discussion
Occasional slow runs
First, let’s talk about those occasional slow runs.
The low variance in the results suggests a bimodal pattern – there’s a fast mode, and a slow mode.
There’s no clear, singular pattern as to when these slow runs happen, although there’s a hint that it appears most often:
- at 9 threads, when the first E-Core is added to the party
- at 20 threads, when all cores are allocated.
I’m not sure why this is yet. Some thoughts:
- Sub-optimal core allocation. Maybe you ask for 6 threads, but instead of 6 P-Cores you get 3 P-Cores and 3 E-Cores.
- Bad scheduling – even if you do get the most efficient cores, perhaps the workload isn’t always distributed as well as it could be between them.
- Some weird cache behaviour.
- A background process gets in the way (this seems unlikely, as this is the point of the E-Cores – to pick up this slack, although it might account for the possible more frequent slow runs at 20 cores)
- CPU throttling (unlikely, temps never got above 76 degrees)
But I’ll have to investigate this further to find out what’s causing it, and work out if it’s just something you have to expect from this CPU once in a while, or if it’s something specific to my setup.
Now let’s go over the hypotheses…
We should see higher t/s with more lower bit quantisation
Supported.
Overall, The t/s are really good – very usable at the higher bit quants and very fast at the lower bits.
There’s an interesting comparison worth pointing out:
Two of the models have the exact same size, but different quantisation approaches:
- Q5_0
- Q5_K_S
These are both 767MB. This controls for model size and let’s us compare the impact of the quantisatio approach.
Turns out, the K quant version is ~10 t/s faster! This is most likely because llama-cpp is better optimised for these K quants than the older, uniform quants.
We should see clear scaling in t/s as we add more P-Cores.
Supported.
This is clear across all models.
At some point t/s will tail off (maybe at 4 cores)
Supported – but not at 4 cores.
There is a very clear tail off in speed after 8 cores (so for this model, CPU, and RAM speed at least, there is plenty of work for all the P-Cores to do and you’re better off using all 8).
Adding E-Cores will not increase t/s (may decrease it)
Not supported!
Well, to be precise, the lack of increase is supported for most models (though a few of them improve). We definitely don’t see a decrease in performance after adding the E-Cores, compared with only using all 8 P-Cores, but performance flattens off.
But, there are a couple of interesting cases.
In most models, it’s pretty much a full flattening, with no benefit gained from the E-Cores. But in three models you can see notable gains:
- Q3_K_M
- Q4_K_M
- Q4_K_S
These don’t seem to be artifacts – if you look at the very wide chart from earlier, the timings for each number of threads for these models show low variance across the 4 runs.
Of course, 4 runs isn’t a lot – but if these were fluke findings, you probably wouldn’t expect it to happen four times on the same three models. It’s around a 10-15 t/s increase, so nothing to sneeze at if true. It would be worth doing extra runs on these models to confirm that.
Conclusions
For practical use, these results suggest:
- The t/s you can get are very good for this small model, especially when quantised. If fine-tuned for a specific purpose it could be a useful part of a larger system.
- You should use all 8 P-Cores on a 265KF with this model.
- There might be some benefit to using the E-Cores – but only with some specific quantisations of this model, and this needs to be confirmed.
- You might expect occasional slow speeds with this CPU (again, need to double-check), but generally speaking, it’s speeds are consistent with very little variation in t/s.
Next steps
There are a couple of things to follow up on:
- Extra runs on Q3_K_M, Q4_K_M, and Q4_K_S to see if the E-Core gains are flukes
- Investigate why we see the occasional slow runs
- Try again with larger models